

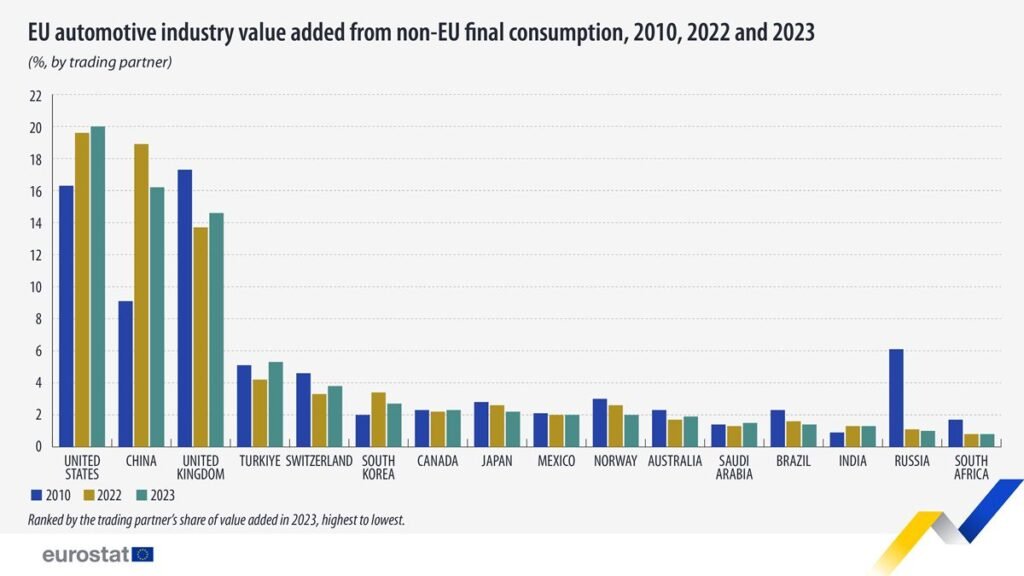
The United States was the largest consumer of EU automotive products in 2023, accounting for 20% of the total EU domestic value added, according to figures released by Eurostat.


The data from the EU’s statistics agency shows that the EU automotive industry generated some €91.6 billion in domestic value added from non-EU consumers, marking a nominal increase of 74% compared with 2010 (€52.7 billion) and a 7% rise from 2022 (€85.4 billion).
Apart from the U.S., China, now a significant market for the EU automotive sector, saw its share grow from 9% in 2010 to 20% in 2021, but reverted to 16% in 2023, making that country still the second-largest consumer. The third-largest market was the United Kingdom, contributing 15% to the EU’s domestic value added.
Between 2010 and 2023, the EU value added from the Chinese market experienced the largest growth (from €4.8 billion to €14.8 billion, +211%). By contrast, Russia recorded the largest drop (from €3.2 billion to €0.9 billion, -73%).
This information comes from data on macroeconomic globalisation indicators based on Full international and global accounts for research in input-output analysis (FIGARO) tables. This article presents some findings from a more detailed Statistics Explained article on employment and value added using FIGARO data – view into the automotive industry.

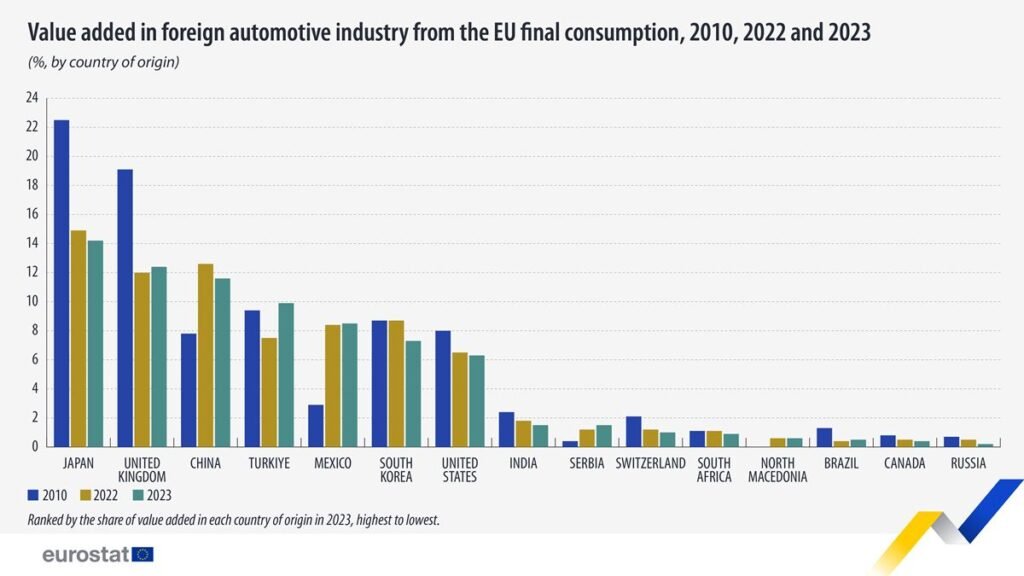
In 2023, value added in the automotive industries outside the EU, driven by final consumption in the EU, reached €34.4 billion. This represents an increase in nominal terms of 130% since 2010 (€14.9 billion), and 6% compared with 2022 (€32.3 billion).
Most of the value added in the foreign automotive industry from EU consumption was attributed to producers from Japan (14%), the United Kingdom and China (12% each).
Between 2010 and 2023, the largest growths relative to the EU consumption were recorded in the automotive industry of North Macedonia (from €4 million to €194 million, +5 322%), Serbia (from €61 million to €500 million, +713%) and Mexico (from €437 million to €2 913 million, +567%). By contrast, Russia recorded the largest drop (from €100 million to €63 million, -37%).
More information on global trade and investment trends, also for other industries, is available in the detailed Statistics Explained article on employment and value added using FIGARO data – an analysis with FIGARO data published by Eurostat today.
Thematic section on ESA supply, use and input-output tables, Eurostat


