

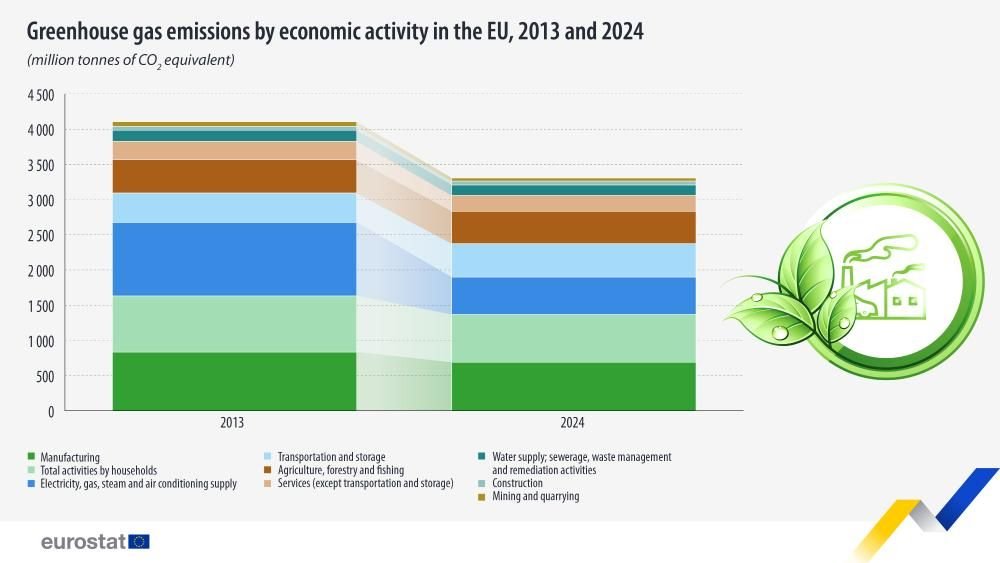
The EU economy’s greenhouse gas emissions by economic activities and households totalled 3.3 bn tonnes of CO2 equivalents in 2024, representing a 20% reduction compared with 2013.


Between 2013 and 2024, the energy sector (supplying electricity, gas, steam and air conditioning) achieved the sharpest rate of decline and the largest overall decrease, with a 49% drop (-512 million tonnes of CO2 equivalents). In the same period, 3 other economic activities also recorded double-digit reductions: mining and quarrying (-37%, -25 million tonnes of CO2 equivalents), manufacturing (-18%, -146 million tonnes) and services (-14%, -36 million tonnes).
The only two economic activities with an increase in emissions were transport and storage (14%, +57 million tonnes of CO2 equivalents) and construction (+6%, +3 million tonnes).

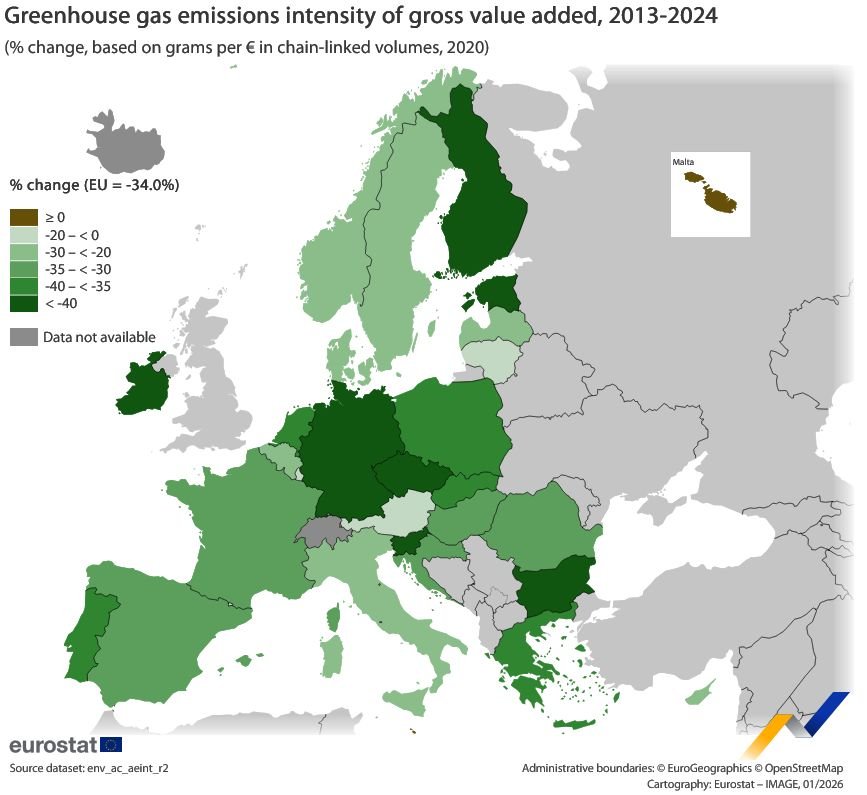
Greenhouse gas emissions intensity measures the amount of emissions (measured in CO2 equivalents) per unit of gross value added (measured in euros) in an economy. It is an indicator of the climate efficiency of economic production. A decrease in the emissions intensity means fewer emissions for the same generation of value added.
Greenhouse gas emissions intensity in the EU decreased by 34% from 2013 to 2024. This is the result of the simultaneous decrease in greenhouse gas emissions by the EU economy and the increase in its value added (+20%). The largest reductions were recorded in Estonia (-64%), Ireland (-50%) and Finland (-44%). Only Malta (+17%) saw its emissions intensity increase since 2013.
Greenhouse gas emissions intensity of gross value added, 2013-20244 – Eurostat

Statistics Explained article on greenhouse gas emission accounts, Eurostat
Online publication on Statistics on climate change mitigation


