Employment and Social Situation Quarterly Review - Q2 2012
28 September 2012by eub2 -- last modified 28 September 2012
The employment and social situation in the European Union remained very serious in the second quarter of 2012 with unemployment rising overall but also displaying significant differences between EU Member States, households' financial situation deteriorating and child poverty increasing. The EU has been in recession or on the verge of it since late 2011 and the overall economic sentiment is at its lowest level in three years. In this context, job-finding prospects remain poor compared to pre-crisis years. Greece and Austria recorded the highest number of hours worked by full-time employed persons in the first quarter of 2012, while Finland, Italy and Ireland recorded the lowest number. These are amongst the main findings of the latest Employment and Social Situation Quarterly Review.
Advertisement
Which data are analysed?
The EU Employment and Social Situation Quarterly Review analyses data from a wide combination of information sources, including Eurostat statistics, reports and survey data from the Commission services, national and sectoral statistics, articles from respected press sources and contributions from public and private employment services.
Additionally, the latest issue of the Review, covering the second quarter of 2012, takes a closer look at the labour markets and social situation in Belgium, Cyprus, the Czech Republic, France, Italy, Lithuania, Luxembourg and Poland. It also reports on the supplementary indicators to unemployment and the measures taken by the Member States to support companies and employees affected by restructuring. Finally, annexed to the regular analysis of sectoral trends, there is a focus on the tourism and hotel, restaurant and café sector.
What is the current labour market situation and outlook?
In the second quarter of 2012 employment remained broadly stable compared with the previous quarter both in the EU and the euro area, after three consecutive quarters of decline, while GDP recorded a minor contraction in the second quarter of 2012 (-0.1 % quarter-on-quarter in the EU, -0.2 % in the euro area). The fall in economic activity stems mainly from further decline in domestic demand. Economic activity and employment declined further in Spain and Portugal. Greece, Bulgaria and Cyprus have seen fast declines in employment too (see Chart 1).
Chart 1: Employment change in 2012 Q2 (yearly change, 000's persons) and quarterly change (%, quarter-on-quarter) in the EU and Member States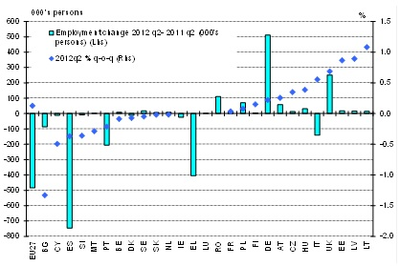
Source: Eurostat, National Accounts, data seasonally adjusted for quarter-on-quarter, 2012 Q2 quarter-on-quarter change not available for Greece, Ireland, Lithuania and Romania.
Employment remains subdued in comparison with 2011, at least compared to the first semester of 2011 when it was still rising: in the EU employment went down by 0.2 % over the year to the second quarter of 2012 – in the euro area it even declined by 0.6 % - while EU GDP was 0.3 % down compared to the second quarter of 2011. All types of employment (whether permanent, temporary or self-employment) are suffering from the weak labour demand, with the notable exception of part-time employment. The EU has been in a recession or at the verge of it since late 2011 and the overall economic sentiment at its lowest level in three years. In this context, not surprisingly, job-finding prospects remain poor compared to pre-crisis years.
How have unemployment and long-term unemployment developed?
The continuous increase in unemployment in the EU over the last 16 months to July 2012 put over 2.6 million more people out of work compared to March 2011 (+11.6 %).
Long-term unemployment accounts for 4.5 % of the active population (up by 0.4 percentage points over the year) at EU level and grew in the majority of Member States, reaching in some cases a historically high level (see Chart 2), although the speed of the increase is gradually declining. Long-term unemployment is, however, expected to continue to grow, owing to the recent surge in the number of recently unemployed people and poor macro-economic prospects. Long-term unemployment may lead to discouragement and withdrawal from the labour market.
Chart 2: Long-term unemployment rates for EU, Euro Area and in the Member States in 2011 Q1 and 2012 Q1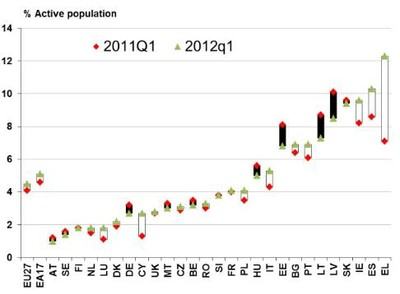
Source: Eurostat, LFS, data non-seasonally adjusted
New figures for 2011 shed light on the broader impact of the crisis on labour market conditions. Beside the unemployed, there were some 8.6 million underemployed part-time workers. In 2011, the EU's potential additional labour force was estimated at 10.9 million people.
How is the financial situation of households?
Gross household disposable income declined in two-thirds of EU countries between 2009 and 2011 (see Chart 3), which explains why the share of the EU population reporting their households are experiencing financial distress remains historically high, having generally edged up further over recent months. Over the last year Italy has recorded a particularly sharp rise in overall financial distress followed by Greece, Ireland, Cyprus, Portugal and Spain. Among households withi the lowest income bracket, the share of people experiencing financial distress has increased further in a majority of Member States. However, richer households, relatively less affected so far, were over the last quarter also more numerous to report having to draw on their savings. Citizens of the countries affected by the steepest income declines are also generally more likely to have negative perceptions of their social situation.
Chart 3: Change in gross household disposable income in the first and second phases of the crisis, in %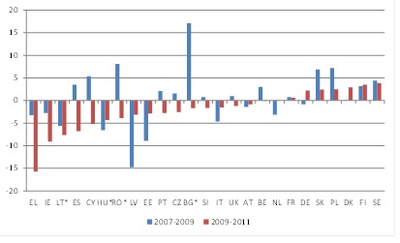
Source: Eurostat, LFS
Note: Lithuania and Malta are missing; * = data is only available until 2010.
What is the child poverty situation?
Child poverty is becoming an issue for a growing number of households. It results from the conjunction of insufficient earnings from parental work and inadequate support to households with children. The size and effectiveness of social expenditure dedicated to children varies a lot across the EU (see Chart 4), pointing to potential scope for improvements in spending to tackle child poverty. In Finland, Hungary and Austria, family and child benefits reduce the risk of poverty of children by 50% or more, against 40% in Germany which spends a similar share of GDP on this type of benefits (around 3.2%). In Spain and Greece, the very low poverty reduction effect (below 5%) of child benefits is mainly due to the low level of spending. Disincentives embedded in the tax and benefit system, and the lack of affordable childcare, also contribute to child poverty as they hamper parents' labour market participation, including that of second earners and lone mothers.
Chart 4: Poverty reduction effect of family and child benefits for children aged 0-17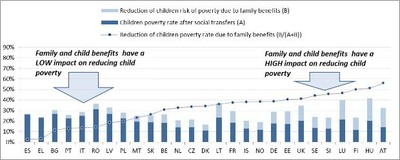
Source: EU-SILC UDB 2010, Ireland and Cyprus not available
What are the recent trends in labour costs and productivity ?
Labour productivity growth in the EU continued to weaken during the second quarter of 2012, with sharp falls in Italy, Hungary and the United Kingdom. Nominal wage growth strengthened in some Member States, especially the United Kingdom and Finland, while it remained subdued in others such as Spain and negative in Slovenia. Greece continues its path of sharp decreases in nominal labour cost that started in the second quarter of 2010. Nominal unit labour cost developments differed somewhat across Member States with the United Kingdom posting strong growth, while Spain saw another decline. The real unit labour cost, which was falling in the EU over 2010-11, has regained upward momentum in some Member States, in the UK in particular.
What are the developments with regards to restructuring?
As restructuring is a permanent characteristic of economic development, Member States are increasingly putting in place a range of instruments to support companies and employees affected by restructuring, as reflected in a recently published Eurofound database.
What is the situation in the tourism and hotel, restaurant and café sector?
The tourism and the hotel, restaurant and café sector generates roughly 3.5 % of the EU GDP, and employs more than 11 million people, accounting for 5 % of the total labour force. Employment in the tourism industry held up fairly well through the crisis, when compared to staggering falls in its value added. It is however unclear if jobs can continue to be kept unless demand and output recover quickly.
Full version of the Quarterly EU Labour Market Review, September 2012
Source: European Commisison